|
| |
|
| |
|
|


|
|
TCHS 4O 2000 [4o's nonsense] alvinny [2] - csq - edchong jenming - joseph - law meepok - mingqi - pea pengkian [2] - qwergopot - woof xinghao - zhengyu HCJC 01S60 [understated sixzero] andy - edwin - jack jiaqi - peter - rex serena SAF 21SA khenghui - jiaming - jinrui [2] ritchie - vicknesh - zhenhao Others Lwei [2] - shaowei - website links - Alien Loves Predator BloggerSG Cute Overload! Cyanide and Happiness Daily Bunny Hamleto Hattrick Magic: The Gathering The Onion The Order of the Stick Perry Bible Fellowship PvP Online Soccernet Sluggy Freelance The Students' Sketchpad Talk Rock Talking Cock.com Tom the Dancing Bug Wikipedia Wulffmorgenthaler |
|
bert's blog v1.21 Powered by glolg Programmed with Perl 5.6.1 on Apache/1.3.27 (Red Hat Linux) best viewed at 1024 x 768 resolution on Internet Explorer 6.0+ or Mozilla Firefox 1.5+ entry views: 218 today's page views: 352 (14 mobile) all-time page views: 3386393 most viewed entry: 18739 views most commented entry: 14 comments number of entries: 1226 page created Fri Jun 20, 2025 08:15:33 |
|
- tagcloud - academics [70] art [8] changelog [49] current events [36] cute stuff [12] gaming [11] music [8] outings [16] philosophy [10] poetry [4] programming [15] rants [5] reviews [8] sport [37] travel [19] work [3] miscellaneous [75] |
|
- category tags - academics art changelog current events cute stuff gaming miscellaneous music outings philosophy poetry programming rants reviews sport travel work tags in total: 386 |

| ||
|
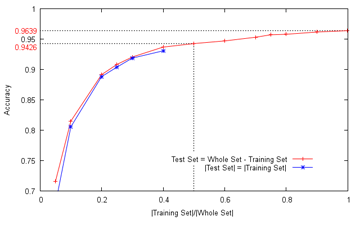
- academics - Since the organizers very kindly extended the deadline again (which I suspect is something of a custom in academic circles), I got another weekend to tinker with the cell data (not Excel!), and here's the overview:  I can't even begin to express my appreciation for datasets which can be quickly processed (which my main line of research, alas, is not), and since LIBSVM was blindingly fast too, I produced the above graph by adjusting the training and test set sizes. Recall that about a fortnight ago, I reported an accuracy of about 88%, obtained by splitting the entire set into disjoint training and test sets of (approximately) equal sizes, training an SVM model on the training set, computing the accuracy on the test set, and averaging for ten runs; in the above chart, the equivalent accuracy on the updated feature set can be obtained by following the line vertically upwards from 0.5 on the x-axis (i.e. training set size divided by the entire set size is 0.5) until it hits the red curve, and this returns an improved accuracy of 94.26%, averaged over a hundred runs this time (the accuracy for individual runs tends to be within ±3%) It can be observed that the larger the training set size in relation to the test set, the better the accuracy. This is not too surprising, since a larger training set intuitively contains more information, allowing better generalizations to be drawn. Note however that the cell classes are distinct enough that even with only a handful of samples (about five to ten) from each class, an overall accuracy of over 70% can still be obtained. The rightmost datapoint does not actually touch the line x=1, since it was obtained using the leave-one-out method - for each cell image, all the other images were used to train the SVM model, and since there is only one possible combination, no averaging is required. The accuracy achieved is 96.39%. It might then be instructive to consider the confusion matrix for the leave-one-out case (zeroes omitted):
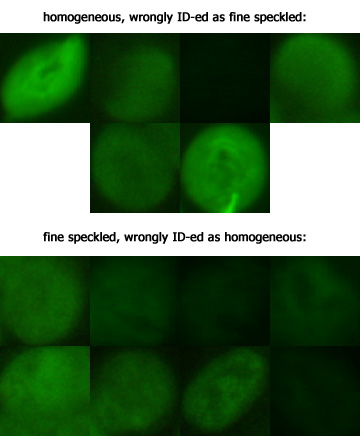
From the matrix, six homogeneous cells were incorrectly classified as fine speckled cells (and so on). As can be seen, the bulk of the remaining confusion exists between homogeneous and fine speckled cells, which together account for 14 of the 26 errors. Just for completeness' sake, let us examine these intransigent lads (rescaled to identical size):  For the most part, I frankly can't see s**t, captain I suppose this shall have to do for now, having run out of time, though some of the misclassifications remained disappointing. This may also serve to illustrate that by far the most gains in such tasks (if not too complicated) are usually obtained at the beginning, and the final drops of incremental progress (see for instance the Netflix Prize) can be notoriously difficult to squeeze out. So, what features were used? Once again, there is nothing particularly devious here, with the final collection of 22 features chosen empirically. I suppose attempting to select them via a more principled procedure is possible too, but that will have to wait. The features used can roughly be put into seven categories:
If anybody's wondering why there's only one dark blob feature, blame my experiments (at the 50-50 split level) So how important are each of these categories of features? Running leave-one-out on various selected subsets (the average accuracies for equal-sized splits is generally a few points lower) of the full feature set gives:
*On hindsight, proper transformation of the images coupled with fairly good texture descriptors appears sufficient; however, as there were some particularly bad nucleolar cell misclassifications without the additional features, this did not sit very well with me, and therefore I opted for the larger feature set, which should still sit within the expected error range. Actually, I had also forgotten the basic mean feature of the statistical distribution category at one stage - that cost several percentage points. All this seems to imply that the problem might be less complex than I had expected - hopefully I have not made any dreadfully embarrassingly gross mistakes in the methodology, but in any case I'll find out in due time, when the official results on the real test set are released. Not too bad a learning experience for two weekends... Next: Between Many Lines
Trackback by Earn Money Online india
Trackback by where to get beats
|
|||||||||||||||||||||||||||||||||||||||||||||||||||||||||||||||||||||||||||||||
 Copyright © 2006-2025 GLYS. All Rights Reserved. |
|||||||||||||||||||||||||||||||||||||||||||||||||||||||||||||||||||||||||||||||